During the summer we take advantage of a lull in the action to make site improvements. This summer has been no different. We’ve moved the blog to WordPress, a much more robust framework. One advantage is the ability to customize pages.

NYSkiBlog began in 2008 as a weather resource and in 2012 we’re taking our ski weather page to the next level. We hope the new format will provide a convenient way to get current and forecast ski conditions and weather quickly.
The top of the weather page will continue to feature the NWS Albany Weather Synopsis, updated every morning. We’ll also continue with the point forecast map for eastern New York. Click on any spot on the map and get a full forecast for that specific location. Below the point forecast map we’ve included the NWS forecast discussions for the NWS offices of New York: Albany, Binghamton, Burlington VT, Buffalo, and New York City.
We’ve also added a large custom topographic ski radar that includes major ski areas of New York and the Northeast. As the season gets closer we’ll add a 48 hour snowfall map of the northeast and other goodies to accommodate the special needs of skiers in winter. We’ll round out our page with longer term precipitation and temperature forecasts.
The single sidebar on the right will feature NWS point forecasts for the major New York (and select Vermont) resorts, plus links to ski resort reports and webcams from around the state. If you’ve got input on the new weather page, of suggestions for improvements, please post in the comments below.

Sounds great to have all that in one spot on the blog site.
Two thumbs up for the new format! I like the idea of the ski radar and the 48 hr snowfall map. Congrats, your always improving the blog.
This could be a helpful link to include:
State Daily Precip Reports
@skimore: that’s a great link. Since Adirondack Weather Site has stopped publishing, we’ve removed it from the “North Country Weather” links and added NY Precip Totals in it’s place. Thanks.
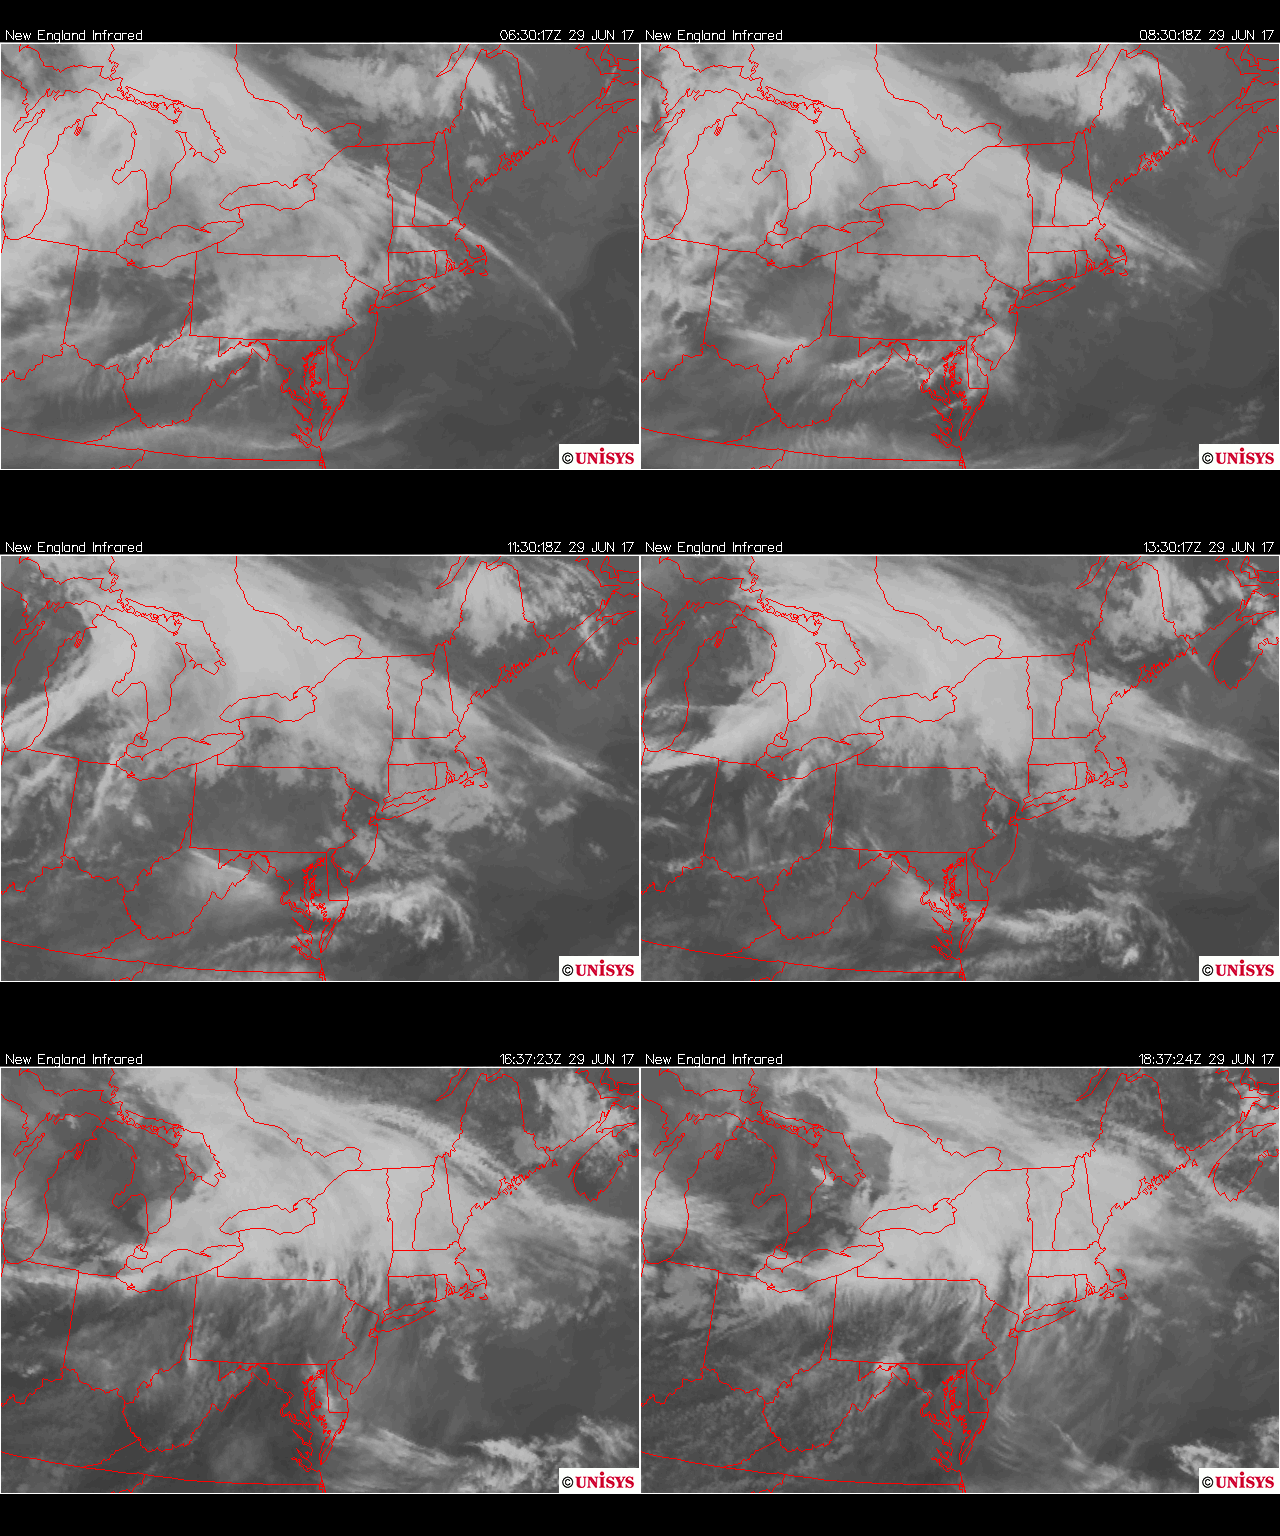
Harv, weather page looks great.. Not crazy about 6-14 day map, but I know people enjoy them.. Sat loop is a nice addition..
Jason – you don’t see value in either the 6-10 temp or the 8-14 day NOAA numbers? I get that.
What do you look at? How far out would you go for temps? What visual/image would you use to display longer term temp trends?
Weather page is now in winter mode. Bring it!