
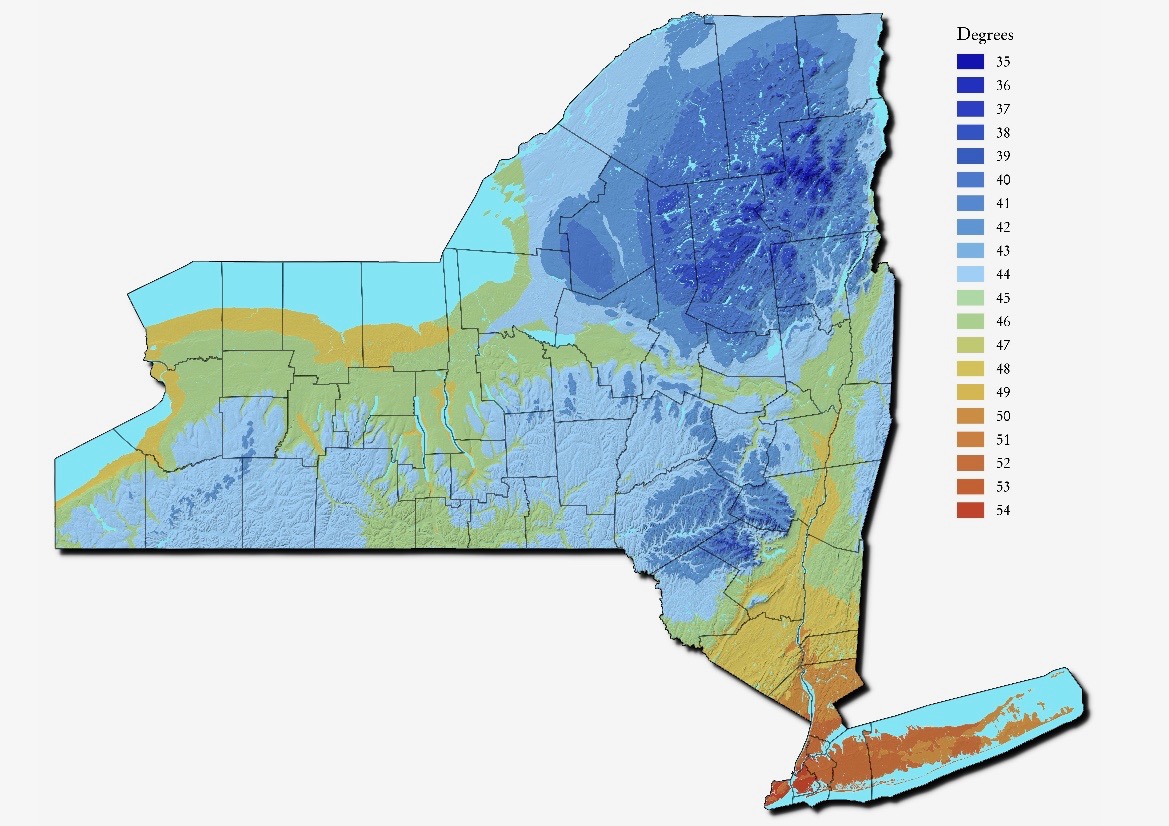
What is the average temperature for New York?
The long term annual average temperature in New York State is approximately 45° across the state. Regional variations range from around 39° in the Adirondack Mountains to about 55° in New York City. The urbanization of New York City creates an urban heat island, which causes temperatures to be warmer in all seasons, especially at night.
 |
 |
| Avg Low Temp | Avg High Temp |
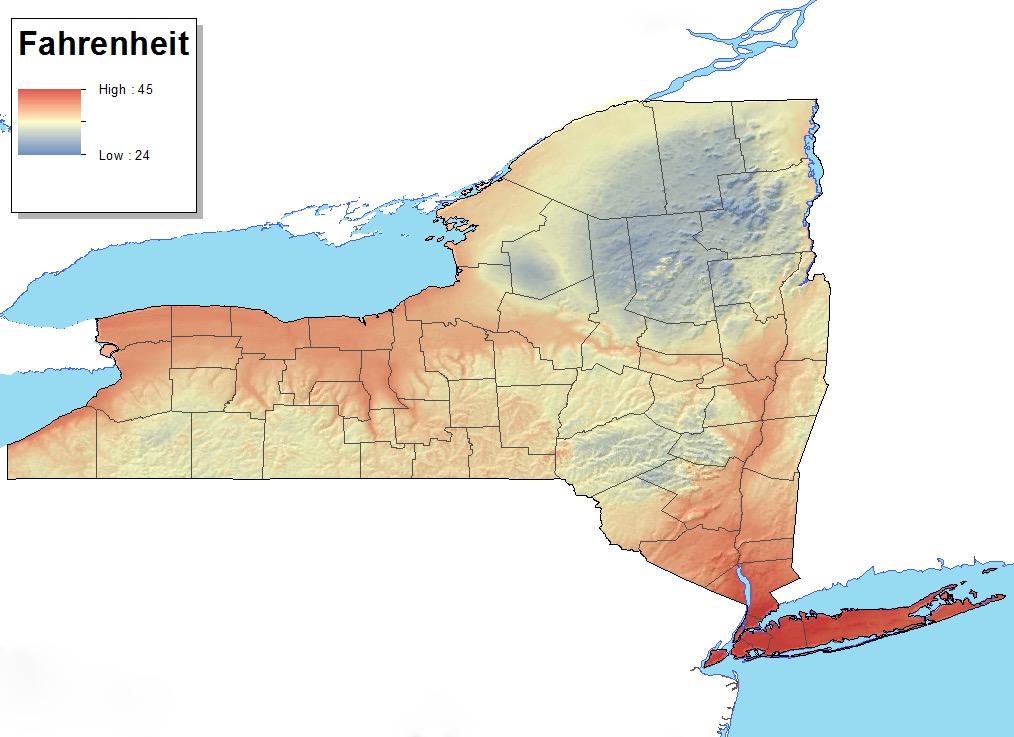
Winter Temperatures
Winter temperatures prevail from November through April in northern New York, and from December through March in the southern part of the state. Average winter high temperatures in New York range from the 10s to mid 40s°F across the state. Temperatures average below freezing in January and February across much of the state, but average above freezing along the coast. Cold-air damming east of the Appalachian mountains can create cloud cover and precipitation primarily in winter, helping to keep average temperatures down.
The record low for New York state is -52°F and was set twice, in February of 1934 and in February of 1979.
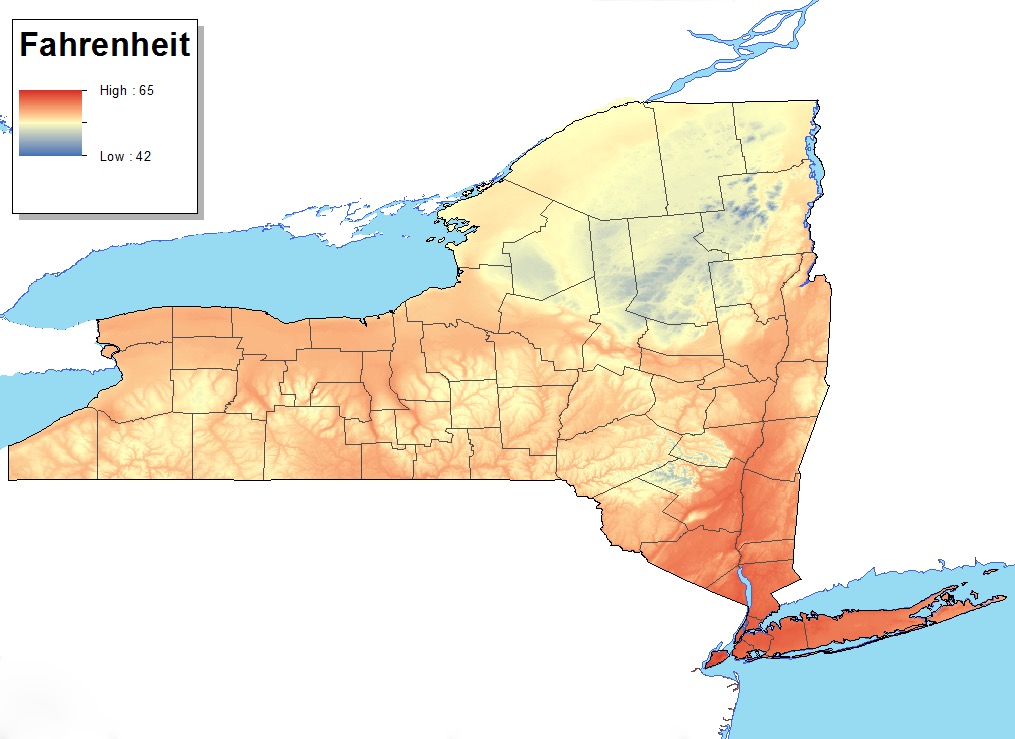
Summer Temperatures
Summer high temperatures range from the upper 70s to mid 80s°F over much of the state. Summer temperatures prevail from June to early September statewide, while areas in far southern New York and NYC have summer conditions from late May through early October. The summer is cooler in the mountains and on the Alleghany Plateau due to the higher elevation. New York City and lower Hudson Valley have hotter and more humid temperatures and higher dew points.
The record high for New York state is 108°F, set in July of 1926.
NY Average Temperature by County
| Coldest | County | Avg Temp °F |
| 01 | Hamilton County | 39.8 |
| 02 | Essex County | 40.3 |
| 03 | Franklin County | 40.3 |
| 04 | Lewis County | 41.2 |
| 05 | Clinton County | 41.7 |
| 06 | Herkimer County | 41.7 |
| 07 | St. Lawrence County | 41.8 |
| 08 | Warren County | 42.3 |
| 09 | Fulton County | 43.6 |
| 10 | Jefferson County | 43.6 |
| 11 | Delaware County | 43.8 |
| 12 | Oneida County | 44.0 |
| 13 | Otsego County | 44.0 |
| 14 | Madison County | 44.1 |
| 15 | Cortland County | 44.2 |
| 16 | Chengango County | 44.4 |
| 17 | Schoharie County | 44.4 |
| 18 | Washington County | 44.5 |
| 19 | Allegany County | 44.7 |
| 20 | Cattagaugus County | 44.7 |
| 21 | Wyoming County | 44.7 |
| 22 | Oswego County | 44.9 |
| 23 | Saratoga County | 44.9 |
| 24 | Greene County | 45.9 |
| 25 | Steuben County | 45.2 |
| 26 | Sullivan County | 45.2 |
| 27 | Broome County | 45.6 |
| 28 | Schuyler County | 45.6 |
| 29 | Tompkins County | 45.6 |
| 30 | Onodaga County | 45.7 |
| 31 | Rensselaer County | 45.7 |
| 32 | Chautauqua County | 45.8 |
| 33 | Chemung County | 45.8 |
| 34 | Tioga County | 45.8 |
| 35 | Montgomery County | 45.9 |
| 36 | Ulster County | 45.9 |
| 37 | Genesee County | 46.0 |
| 38 | Schenectady County | 46.0 |
| 39 | Cayuga County | 46.1 |
| 40 | Erie County | 46.2 |
| 41 | Yates County | 46.2 |
| 42 | Albany County | 46.3 |
| 43 | Livingston County | 46.3 |
| 44 | Ontario County | 46.3 |
| 45 | Orleans County | 46.6 |
| 46 | Wayne County | 46.6 |
| 47 | Monroe County | 46.9 |
| 48 | Niagara County | 46.9 |
| 49 | Columbia County | 47.0 |
| 50 | Seneca County | 47.0 |
| 51 | Dutchess County | 47.7 |
| 52 | Orange County | 47.8 |
| 53 | Putnam County | 48.2 |
| 54 | Rockland County | 49.7 |
| 55 | Westchester County | 50.0 |
| 56 | Suffolk County | 50.3 |
| 57 | Nassau County | 51.8 |
| 58 | Bronx County | 52.6 |
| 59 | Queens County | 52.6 |
| 60 | Richmond County | 52.7 |
| 61 | New York County | 52.8 |
| 62 | Kings County | 53.0 |
Sources:
• NOAA National Centers for Environmental Information, (1901-2000 Mean)
• PRISM Group Oregon State University