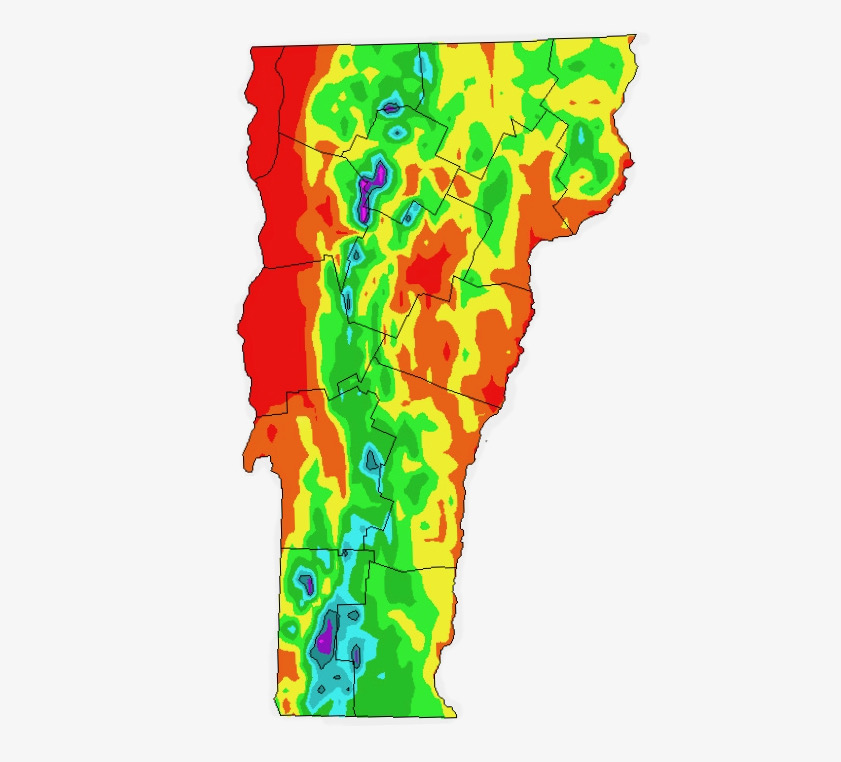
On average, Vermont gets 43 inches of precipitation each year. This include the liquid equivalent from a statewide average of 86 inches of snow per year. Vermont gets some kind of precipitation, on average, 150 days per year. Precipitation is rain, snow, sleet, or hail that falls to the ground.

Vermont annual precipitation has been above average for the last several decades. The driest periods were in the 1910s and the early 1960s. The wettest periods have occurred since 2005. The driest 5-year period was 1961–1965 and the wettest was 2007–2011. The annual number of extreme precipitation events — days with greater than 2 inches of precipitation has been above the long-term average over the past two decades since 1995. Average annual precipitation has increased nearly 6 inches since the 1960s.
Vermont Precipitation by Location
| Days Precip/Year | Town/Place | Avg Precip/Year” |
| 204 | Mount Mansfield | 81″ |
| 175 | Newport | 41″ |
| 164 | St Johnsbury | 40″ |
| 164 | Essex Junction | 41″ |
| 156 | Burlington | 37″ |
| 143 | St Albans | 38″ |
| 125 | South Hero | 34″ |
| 171 | South Lincoln | 48″ |
| 149 | Montpelier | 37″ |
| 131 | Rochester | 48″ |
| 146 | Cavendish | 47″ |
| 137 | Woodstock | 44″ |
| 136 | Rutland | 41″ |
Sources:
• Image courtesy NOAA
• www.currentresults.com
• www.personal.psu.edu
• www.bestplaces.net
• statesummaries.ncics.org

