
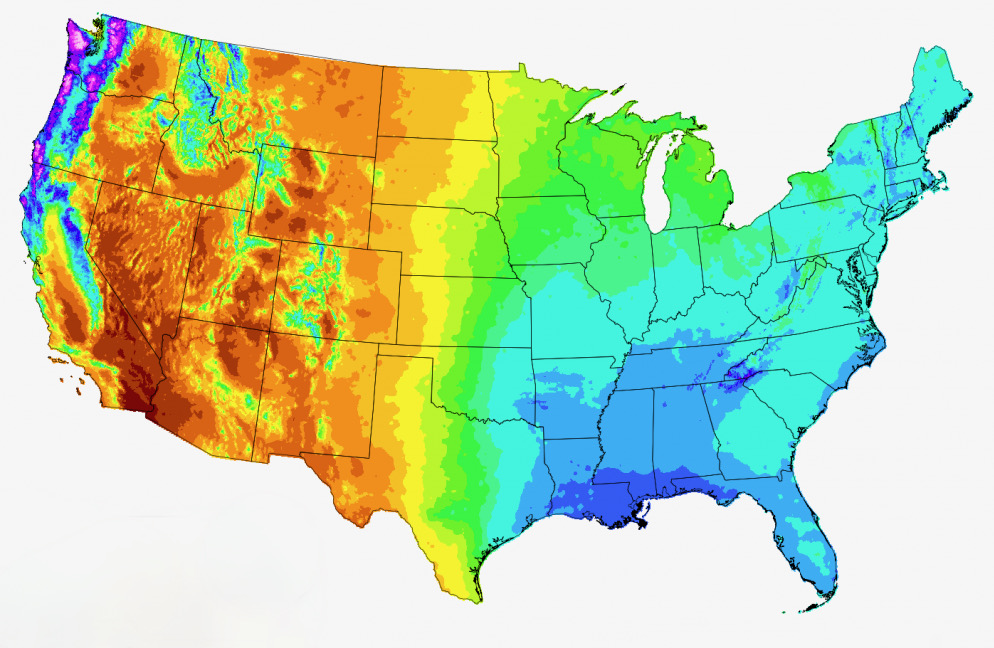
The 100th meridian is a near perfect and stark dividing line that separates the abundant rainfall in the east from the predominantly desert conditions of the west. In the West, the highest elevations including mountains of the Pacific Northwest and Northern California are the most notable exceptions. The Gulf of Mexico is clearly a major influence in the East.
US Average Precipitation by State
| Rank | State | Avg Precipitation/Year” |
| 01 | Louisiana | 59.2″ |
| 02 | Mississippi | 56.5″ |
| 03 | Alabama | 56.0″ |
| 04 | Florida | 54.7″ |
| 05 | Tennessee | 51.9″ |
| 06 | Hawaii | 50.3″ |
| 07 | Georgia | 50.2″ |
| 08 | Connecticut | 50.1″ |
| 09 | Rhode Island | 50.0″ |
| 10 | Arkansas | 49.8″ |
| 11 | South Carolina | 49.2″ |
| 12 | Massachusetts | 48.4″ |
| 13 | New Jersey | 48.0″ |
| 14 | North Carolina | 46.9″ |
| 15 | Kentucky | 46.4″ |
| 16 | Delaware | 45.8″ |
| 17 | Maine | 45.5″ |
| 18 | New Hampshire | 44.8″ |
| 19 | West Virginia | 44.4″ |
| 20 | Oregon | 43.6″ |
| 21 | New York | 42.9″ |
| 22 | Pennsylvania | 42.8″ |
| 23 | Virginia | 42.8″ |
| 24 | Maryland | 42.7″ |
| 25 | Vermont | 42.6″ |
| 26 | Missouri | 42.5″ |
| 27 | District of Columbia | 42.2″ |
| 28 | Indiana | 41.9″ |
| 29 | Ohio | 39.2″ |
| 30 | Washington | 38.7″ |
| 31 | Illinois | 38.5″ |
| 32 | Oklahoma | 37.6″ |
| 33 | Texas | 35.0″ |
| 34 | Iowa | 34.5″ |
| 35 | Wisconsin | 33.1″ |
| 36 | Michigan | 32.8″ |
| 37 | Kansas | 32.4″ |
| 38 | Alaska | 29.0″ |
| 39 | Minnesota | 28.6″ |
| 40 | Nebraska | 26.7″ |
| 41 | California | 23.0″ |
| 42 | South Dakota | 22.0″ |
| 43 | North Dakota | 18.6″ |
| 44 | Colorado | 17.0″ |
| 45 | Idaho | 16.9″ |
| 46 | Utah | 15.8″ |
| 47 | Montana | 14.9″ |
| 48 | New Mexico | 14.2″ |
| 49 | Wyoming | 13.2″ |
| 50 | Arizona | 11.8″ |
| 51 | Nevada | 09.5″ |
Sources:
• prism.oregonstate.edu
• www.usa.com