
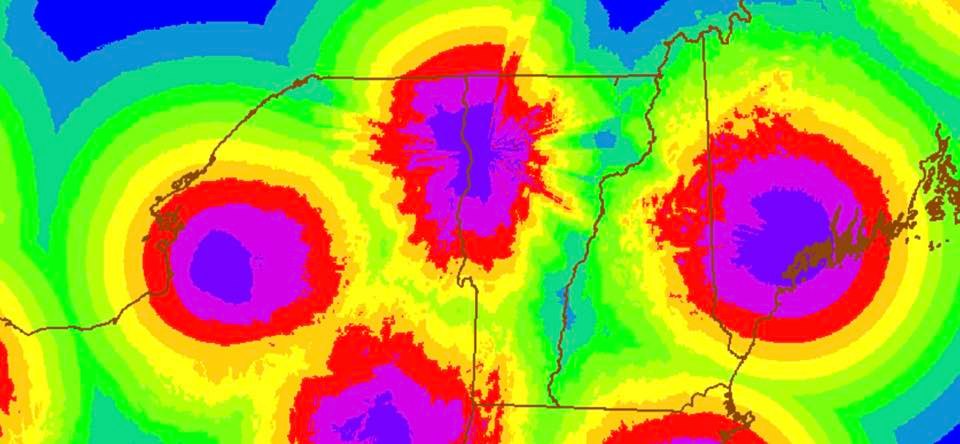
The Radar Quality Map (RQI) is an NOAA product that indicates how accurate radar is in each location. Darker areas show the source of each radar location and the strongest signal. Radar Quality Index can be used as a real-time map of radar coverage voids, thus providing guidance for deploying gap-filling radars.
Radar Quality Index can be used as a real-time map of radar coverage voids, thus providing guidance for deploying gap-filling radars.
The RQI field is updated every 2 minutes and represents the real-time radar QPE quality distribution across the continental US under different synoptic regimes, radar scanning strategies, and even radar outage situations. Because of this update resolution, each radar precipitation rate field has an associated RQI field.
There are seasonal, synoptic and geographical impacts on the Radar Quality Index.
The seasonal and synoptic tendencies are related to freezing level heights: The lower the height of freezing air, the lower the RQI. During the warm season, RQIs tend to be higher as freezing levels are higher. Often you can see the impact of a cold front on the index.
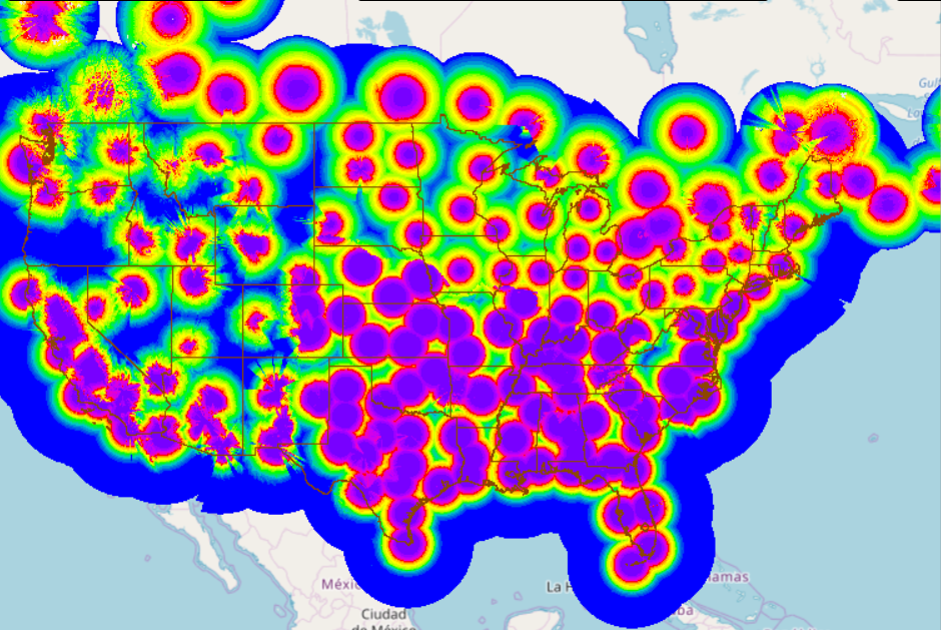
Distance from the source and terrain blocking the signal can also degrade the quality of the data provided. You can see from the US RQI Map that cover is more complete in non-mountainous areas.
Source:
• NOAA