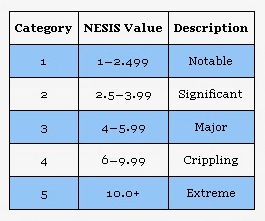
 The Northeast Snowfall Impact Scale — The NESIS Scale — was developed by Paul Kocin and Louis Uccellini of the National Weather Service to characterize and rank high-impact Northeast snowstorms.
These storms have large areas of 10 inch snowfall accumulations and greater. NESIS has five categories: Extreme, Crippling, Major, Significant, and Notable.
The index differs from other meteorological indices in that it uses population information in addition to meteorological measurements. Thus NESIS gives an indication of a storm’s societal impacts. This scale was developed because of the impact Northeast snowstorms can have on the rest of the country in terms of transportation and economic impact.
NESIS scale scores are a function of the area affected by the snowstorm, the amount of snow, and the number of people living in the path of the storm. The aerial distribution of snowfall and population information are combined in an equation that calculates a NESIS score which varies from around one for smaller storms to over ten for extreme storms. The raw score is then converted into one of the five NESIS categories. The largest NESIS values result from storms producing heavy snowfall over large areas that include major metropolitan centers.
Top 10 NESIS Storms
| Rank | Start Date | NESIS | Category | Description |
| 01 | 03/12/93 | 13.20 | 5 | Extreme |
| 02 | 01/06/96 | 11.78 | 5 | Extreme |
| 03 | 02/15/18 | 8.91 | 4 | Crippling |
| 04 | 03/02/60 | 8.77 | 4 | Crippling |
| 05 | 02/02/61 | 7.06 | 4 | Crippling |
| 06 | 01/11/64 | 6.91 | 4 | Crippling |
| 07 | 01/21/05 | 6.80 | 4 | Crippling |
| 08 | 01/19/78 | 6.53 | 4 | Crippling |
| 09 | 12/25/69 | 6.29 | 4 | Crippling |
| 10 | 02/10/83 | 6.25 | 4 | Crippling |
Source: NOAA
