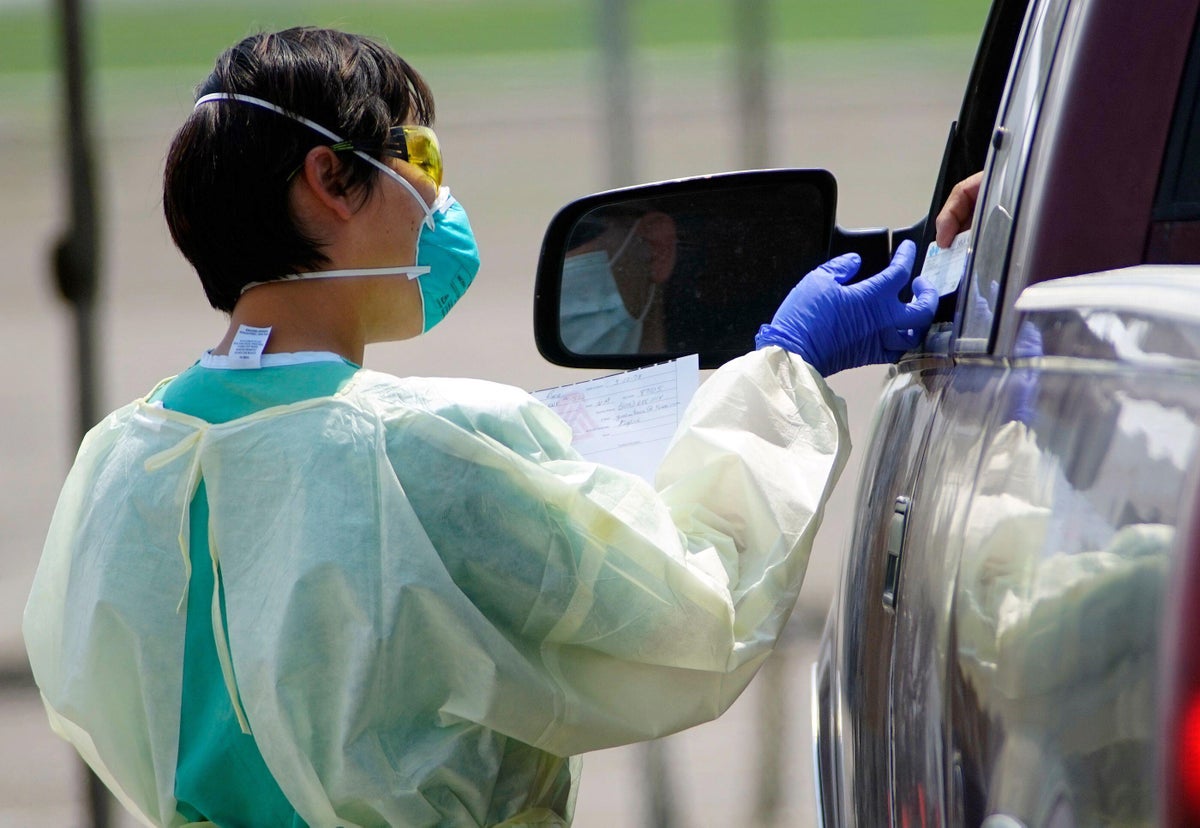
The New Normal

Status
Not open for further replies.
Lest anyone think we're returning to "normal" any time soon.

SUNYAC conference cancels allwinter sports
 
Here's the latest NY map from nytimes.com ...

NY
 
the only issue on info on this site is you putting out info that fits your narrative , Harvey gave information that is useful on how to not see your posts anymore, that is helpful, you are not helpful and you continue that saying that someone taking what you write as “news” is the issue, I get plenty of useful ”news” information off this site . I see quite a few smart people on this site who give useful “news” information and respect them they make this site legitimate

A little touchy, aren't we?

You used the term "fake news", (with all of its political connotations) I just responded with your words. Also, just because someone says something you may not agree with or you don't think is correct does not necessarily mean it is fake news.

In this case, MarzNC, was correct. The scientific data backs up her statements that when comparing the rates of infection/100k people, AZ has a much higher infection rate taking total population into account.


You responded to a thread in the "off-topic" section of a ski forum. It would be more collegial of you to take things with a grain of salt and not attack someone that may have a different view than yours.

If anyone in this thread has a narrative or agenda, it is clearly you.
Apparently you are the touchy one, giving directions , how funny Harv gave the solution, no reason for you to chime in other than backing up your buddy, I just called him out and you repli with different information then he gave
 
In this case, MarzNC, was correct. The scientific data backs up her statements that when comparing the rates of infection/100k people,
In Post #221 the first graph is normalized data comparing NM to neighboring states. The actual numbers are in Post #222.

But given how fast things are changing, both graphs are somewhat obsolete in terms of the trend in the last couple weeks. I use CovidActNow to compare states of personal interest. The Trends function makes it easy to compare one state to any others. I live in NC. I have a trip planned to Taos in February. So that's why I'm keeping on eye on NM. Plus my primary ski buddy lives in Albuquerque, as well as a few new friends I've met at Taos in the last few years.

I'm happy that Percent Positive has stayed in the 6-7% range in NC for the past few months. Lower would be better, but it beats the percentages that are happening in the midwest and Mountain West. TN and VA are in the same range as NC. SC has been higher all along, currently has gone up to around 9%. Several of the counties in NC with the highest Percent Positive are along the SC border.

Screen Shot 2020-10-23 at 10.39.39 PM.png


Screen Shot 2020-10-23 at 10.41.19 PM.png
 
Looking at graphs for NYS and neighboring states would be better if it were possible to start around May. Then could see trends since Labor Day better. Of course would be even better to split the state into at least two sections, if not more. The NYC metropolitan area skews the stats a lot.

Looking at normalized data, per 100K, does seem as if CT and NJ are heading in the wrong direction. The real question is whether the number of hospitalizations and deaths will increase in the next few weeks or stay relatively stable. With more people under age 45 getting tested, that could mean more detected cases but hopefully not a similar increase in the number of people with serious symptoms or deaths. Every detected case of COVID-19 means one less person wandering around infecting others without even knowing they are infectious.

Screen Shot 2020-10-23 at 11.00.19 PM.png
 
Looking at graphs for NYS and neighboring states would be better if it were possible to start around May. Then could see trends since Labor Day better. Of course would be even better to split the state into at least two sections, if not more. The NYC metropolitan area skews the stats a lot.

Looking at normalized data, per 100K, does seem as if CT and NJ are heading in the wrong direction. The real question is whether the number of hospitalizations and deaths will increase in the next few weeks or stay relatively stable. With more people under age 45 getting tested, that could mean more detected cases but hopefully not a similar increase in the number of people with serious symptoms or deaths. Every detected case of COVID-19 means one less person wandering around infecting others without even knowing they are infectious.

View attachment 6524
One of the graphs did not have the normalization box checked. The problem with all of this is that you have to rely upon others to do the right thing. But, as we have been seeing, a lot of our country is too worried about themselves to care about the greater good for all.
 
One of the graphs did not have the normalization box checked.
To clarify, the graph in Post #246 is normalized, as noted in the title that says "CASES PER 100K POPULATION." It's just that the screen shot for NY didn't include the top like the screen shots in Post #245. My laptop screen is small. Can only get so much into a screen shot depending on the graph.

I post screen shots every so often just as a record. Same reason I sometimes post a screen shot of snow total predictions.
 
The problem with all of this is that you have to rely upon others to do the right thing. But, as we have been seeing, a lot of our country is too worried about themselves to care about the greater good for all.
I think it's very hard to understand a disease that is both potentially dangerous to some people and not a big deal for others. It's certainly not as simple as saying that COVID-19 is only a problem for people over 60.

Add the fact that someone infected with SARS-CoV-2 can have no symptoms and be contagious for several days. That's just very unusual, even for a coronavirus. Usually just staying away from someone with symptoms is sufficient to break the chain of transmission. As happened for SARS, MERS, and Ebola. But by the time someone tests positive for COVID-19 they usually have been shedding virus for at least 2-3 days. That's also why False Positives can happen if someone gets tested very soon after exposure. Two tests about 2 days apart is a much better way to confirm someone has COVID-19 if they don't develop symptoms.

I know of small colleges that are testing students twice a week. That works. But obviously not practical except for a relatively small number of people.

The percentage of people who have had COVID-19 (some of whom don't even know it) who have recovered is undoubtedly much higher than the percentage who have died, had serious medical problems, or continuing to have lingering medial issues (long haulers). But what makes headlines? Total daily counts of cases, with little mention of the estimate of the number of people who have recovered even on a weekly or monthly basis.
 
Status
Not open for further replies.
Back
Top